Use the following figure to answer the questions :
Figure 7-2 shows the total product curve for different levels of a variable input,labor. 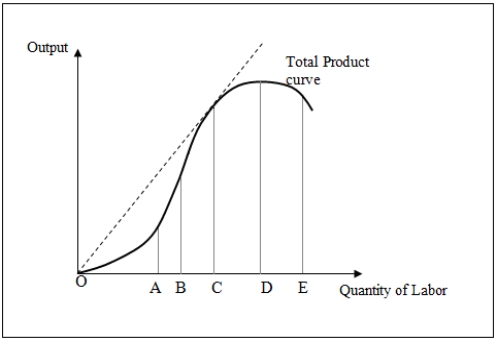
-When the quantity of labor employed lies between points D and E in Figure 7-2:
A) marginal product reaches a maximum and then declines.
B) marginal product reaches a maximum and then becomes negative.
C) total product is increasing at a decreasing rate.
D) total product is decreasing.
Correct Answer:
Verified
Q29: Use the following figure to answer the
Q30: Which of the following statements is true
Q31: When the total product curve with only
Q32: Use the following figure to answer the
Q33: Use the following figure to answer the
Q35: If total product is increasing at a
Q36: When marginal product is decreasing:
A)average product must
Q37: Use the following figure to answer the
Q38: The slope of a ray from the
Q39: The slope of the total product curve
Unlock this Answer For Free Now!
View this answer and more for free by performing one of the following actions

Scan the QR code to install the App and get 2 free unlocks

Unlock quizzes for free by uploading documents