? 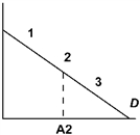
In the picture above the point A2 is half way between the origin and the quantity intercept of the demand curve. The price elasticity at point "2" is
A) 0
B) between -? and -1
C) -1
D) between -1 and 0
Correct Answer:
Verified
Q34: The demand for gasoline is more elastic
Q35: If an individual's housing purchases are always
Q36: If the income elasticity of demand is
Q37: Two goods,X and Y,are called substitutes if
A)an
Q38: Which of the following will not cause
Q40: Two goods,X and Y,are called complements if
A)an
Q41: An increase in the price of good
Q42: If demand is elastic,a decrease in
Q43: In Homogenia everyone is the same.Demand
Q44: The price elasticity of demand for any
Unlock this Answer For Free Now!
View this answer and more for free by performing one of the following actions

Scan the QR code to install the App and get 2 free unlocks

Unlock quizzes for free by uploading documents