Figure 4-3 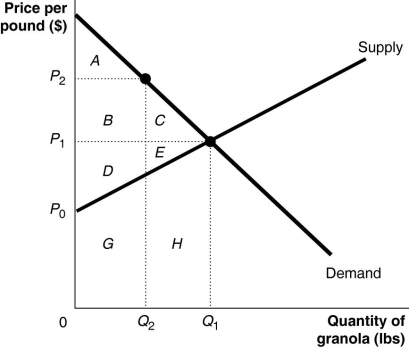 Figure 4-3 shows the market for granola.The market is initially in equilibrium at a price of P1 and a quantity of Q1.Now suppose producers decide to cut output to Q2 in order to raise the price to P2.
-Refer to Figure 4-3.What area represents producer surplus at P2?
A) A + B + D
B) B + D
C) B + D + G
D) B + C + D + E
Correct Answer:
Verified
Q62: Figure 4-3 Q62: The sum of consumer surplus and producer Q64: In a competitive market equilibrium the _ Q66: Figure 4-3 Q67: Deadweight loss refers to Q68: The market price for coffee is $2.25 Unlock this Answer For Free Now! View this answer and more for free by performing one of the following actions Scan the QR code to install the App and get 2 free unlocks Unlock quizzes for free by uploading documents![]()
![]()
A)the opportunity cost to

