The graph below represents the market for alfalfa.The equilibrium price is $7.00 per bushel,but the market price is $9.00 per bushel.Identify the areas representing consumer surplus,producer surplus,and deadweight loss at the equilibrium price of $7.00 and at the market price of $9.00. 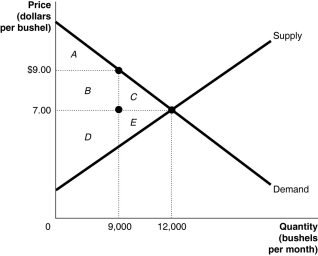
Correct Answer:
Verified
View Answer
Unlock this answer now
Get Access to more Verified Answers free of charge
Q77: Table 4-3 Q109: Which of the following is a consequence Q115: When _ in a market,the total net Q123: In order to be binding,a price floor Q126: Figure 4-5 Q131: A black market is a market where Unlock this Answer For Free Now! View this answer and more for free by performing one of the following actions Scan the QR code to install the App and get 2 free unlocks Unlock quizzes for free by uploading documents
![]()
A)must![]()

