Table 4-3
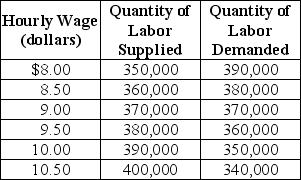
Table 4-3 shows the demand and supply schedules for the low-skilled labor market in the city of Westover.
-Refer to Table 4-3.What is the equilibrium hourly wage (W*) and the equilibrium quantity of labor (Q*) ?
A) W* = $9.00; Q* = 370,000
B) W* = $8.50; Q* = 380,000
C) W* = $8.50; Q* = 360,000
D) W* = $9.00; Q* = 740,000
Correct Answer:
Verified
Q63: The graph below represents the market for
Q66: Table 4-3 Q68: Table 4-3 Q72: Figure 4-5 Q115: When _ in a market,the total net Q125: Figure 4-5 Q126: To affect the market outcome,a price floor Q131: A black market is a market where Q133: Figure 4-5 Q137: Which term refers to a legally established Unlock this Answer For Free Now! View this answer and more for free by performing one of the following actions Scan the QR code to install the App and get 2 free unlocks Unlock quizzes for free by uploading documents
![]()
![]()
![]()
![]()
A)must![]()

