Figure 4.3 shows the supply curves for baby formula.In the figure given below,the development of more efficient production technologies for baby formula is likely to cause which of the following changes? Figure 4.3
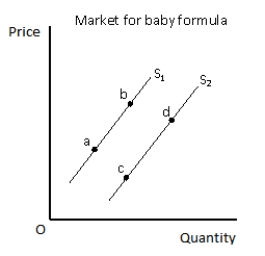
A) A rightward shift of the supply curve from S1 to S2
B) A movement from point a to point b on the supply curve S1
C) A leftward shift of the supply curve from S2 to S1
D) A movement from point c to point d on the supply curve S2
E) A movement from point b to point a on the supply curve S1
Correct Answer:
Verified
Q52: If the price of potato chips increases,other
Q58: The market supply curve of a particular
Q65: A surplus of shoes will cause:
A)a decrease
Q72: Which of the following would shift the
Q75: When quantity demanded of a good exceeds
Q76: Figure 4.2 shows the demand curves for
Q77: The introduction of a new cost effective
Q78: The figure given below shows the supply
Q80: A shortage of textbooks is most likely
Q129: Recently it has been discovered that lobsters
Unlock this Answer For Free Now!
View this answer and more for free by performing one of the following actions

Scan the QR code to install the App and get 2 free unlocks

Unlock quizzes for free by uploading documents