The figure given below shows the income-expenditure model.Which of the following best describes the situation at point B?
Figure 9.1
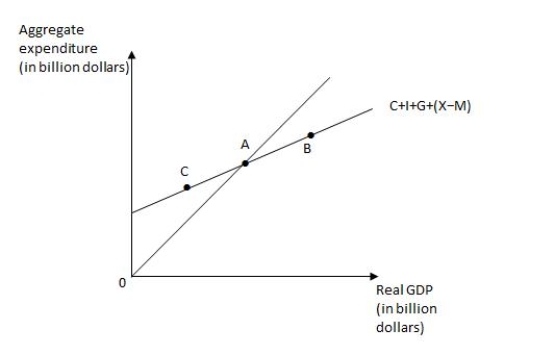
A) Consumption expenditure exceeds disposable income
B) Real GDP exceeds aggregate expenditure
C) Aggregate expenditure is exactly equal to real GDP
D) Aggregate expenditure exceeds real GDP
E) Producers experience an unexpected accumulation of inventory
Correct Answer:
Verified
Q81: Increases in the marginal propensity to consume
Q82: If households save $40 billion less at
Q84: If investment increases by $100 and,as a
Q87: Which of the following best describes the
Q89: In the income-expenditure model,if autonomous investment decreases
Q93: When current production of goods and services
Q94: An increase in autonomous investment in an
Q96: If the marginal propensity to consume (MPC)equals
Q100: In the income-expenditure framework,if planned aggregate expenditures
Q108: The table given below shows the real
Unlock this Answer For Free Now!
View this answer and more for free by performing one of the following actions

Scan the QR code to install the App and get 2 free unlocks

Unlock quizzes for free by uploading documents