The following graph shows the demand for and domestic supply of a good in a country.If the country decides to trade,then at a world price of $1.00 _____.
Figure 17.2
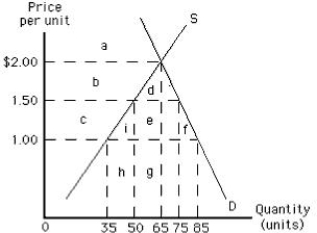
A) 20 units will be exported
B) 20 units will be imported
C) 50 units will be exported
D) 50 units will be imported
E) 10 units will be exported
Correct Answer:
Verified
Q42: Economies of scale in the production of
Q47: Which of the following is not a
Q54: If there are no trade restrictions,a country
Q59: The world demand for and the world
Q76: The following table shows per-day production data
Q77: The following table shows the demand,supply,and price
Q82: The following graph shows U.S.demand for and
Q83: The following graph shows U.S.demand for and
Q85: The following graph shows the supply of
Q86: The following graph shows the supply of
Unlock this Answer For Free Now!
View this answer and more for free by performing one of the following actions

Scan the QR code to install the App and get 2 free unlocks

Unlock quizzes for free by uploading documents