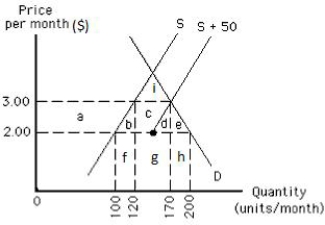
The following graph shows the demand for and the supply of a good in a country.If the world price of the good is $2.00 per unit and an import quota of 50 units per month is imposed,the welfare loss resulting from higher domestic production costs is represented by the area _____.
Figure 17.6
A) a
B) b
C) c and d
D) g and h
E) e
Correct Answer:
Verified
Q64: Suppose the government of an importing country
Q72: Quotas are favoured over free international trade
Q75: A legal limit on the amount of
Q92: Which of the following is not a
Q97: Suppose the government of an importing country
Q99: The following graph shows the supply of
Q100: The following image shows the market for
Q103: The following graph shows the demand for
Q108: The following image shows the market for
Q122: The international treaty established to negotiate lower
Unlock this Answer For Free Now!
View this answer and more for free by performing one of the following actions

Scan the QR code to install the App and get 2 free unlocks

Unlock quizzes for free by uploading documents