The figure given below shows cost curves of a firm.Figure: 8.2
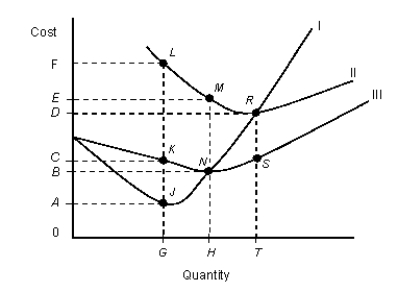 In the figure,
|: Marginal cost curve
||: Average total cost curve
|||: Average variable cost curve
-Refer to Figure 8.2. When Average Variable Cost (AVC) is at a minimum, which of the following is true?
A) AVC equals AB
B) Marginal cost (MC) equals 0G
C) Average total cost exceeds AVC by SR
D) MC equals HN
E) MC equals GJ
Correct Answer:
Verified
Q21: The figure given below shows cost curves
Q22: The below figure shows the various combinations
Q23: The below figure shows the various combinations
Q24: The figure given below shows cost curves
Q25: The figure given below shows the average
Q27: The following table shows the cost of
Q28: The following table shows the cost of
Q29: The following table shows the cost of
Q30: The following table shows the cost of
Q31: The below figure shows the various combinations
Unlock this Answer For Free Now!
View this answer and more for free by performing one of the following actions

Scan the QR code to install the App and get 2 free unlocks

Unlock quizzes for free by uploading documents