The following graph is a binomial distribution with n = 6: 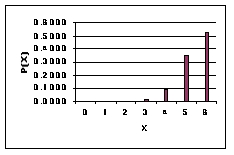 This graph reveals that ___.
A) p > 0.5
B) p = 1.0
C) p = 0
D) p < 0.5
E) p = 1.5
Correct Answer:
Verified
Q8: As in a binomial distribution, successive trials
Q13: For the Poisson distribution the mean and
Q15: Poisson distribution describes the occurrence of discrete
Q17: A hypergeometric distribution applies to experiments in
Q21: A market research team compiled the following
Q22: A market research team compiled the following
Q25: A market research team compiled the following
Q27: The following graph is a binomial distribution
Q28: A market research team compiled the following
Q42: If x has a binomial distribution with
Unlock this Answer For Free Now!
View this answer and more for free by performing one of the following actions

Scan the QR code to install the App and get 2 free unlocks

Unlock quizzes for free by uploading documents