Figure 5-6 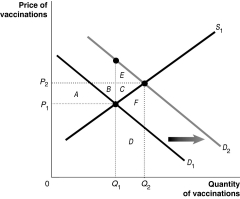 Figure 5-6 shows the market for measles vaccinations, a product whose use generates positive externalities.
-Refer to Figure 5-6. What does D2 represent?
A) the social welfare curve
B) the demand curve reflecting social benefit
C) the demand curve reflecting private benefit
D) the positive externalities curve
Correct Answer:
Verified
Q49: Figure 5-4 Q62: The private cost of a good or Q63: An externality is an example of a Q65: Figure 5-6 Q68: Q70: Article Summary Q71: Article Summary Unlock this Answer For Free Now! View this answer and more for free by performing one of the following actions Scan the QR code to install the App and get 2 free unlocks Unlock quizzes for free by uploading documents
![]()
![]()
![]()
According to a study by the
According to a study by the

