An agronomist used four test plots to determine the relationship between the wheat yield y (in bushels per acre) and the amount of fertilizer x (in pounds per acre) .The results are shown in the table. 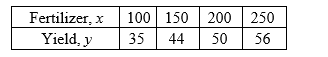
(I) Use the regression capabilities of a graphing utility or a spreadsheet to find the least squares regression line for the data.
(II) Estimate the yield for a fertilizer application of 160 pounds per acre.
A) (I) 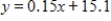 ; (II) 39.10
B) (I) 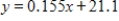 ; (II) 45.90
C) (I) 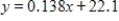 ; (II) 44.18
D) (I)  ; (II) 42.32
E) (I)  ; (II) 54.94
Correct Answer:
Verified
Q63: A rectangular box is resting on the
Q64: Find the critical points of the function
Q65: Use Lagrange multipliers to find the given
Q66: A company manufactures two types of sneakers:
Q67: Find the critical points of the function
Q69: Find the least squares regression line for
Q70: Use the regression capabilities of a graphing
Q71: A manufacturer has an order for 1,100
Q72: Use Lagrange multipliers to find the given
Q73: The sum of the length (denote by
Unlock this Answer For Free Now!
View this answer and more for free by performing one of the following actions

Scan the QR code to install the App and get 2 free unlocks

Unlock quizzes for free by uploading documents