The table below shows the cost  (in millions of dollars) of a 30-second ad during the Super Bowl for several years from 1987 to 2006.
 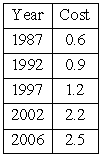 Use the regression feature of a graphing utility to find an exponential model for the data.Predict the cost of a 30-second ad during the Super Bowl in 2012.Round to the nearest ten thousand.
A) $4.29 million
B) $5.01 million
C) $5.86 million
D) $4.64 million
E) $3.67 million
Correct Answer:
Verified
Q81: A stock analyst attempts to express the
Q82: On the Richter scale, the magnitude
Q83: Estimate the percentage of radioactive material that
Q84: An investment is expected to pay 11%
Q85: The half-life of 134Ba is 28.7 hours.How
Q87: You take a three-pound package of steaks
Q88: A hunting club stocks a wildlife preserve
Q89: The chemical acidity of a solution is
Q90: The population P of a bacteria culture
Q91: The decibel (dB) is defined as
Unlock this Answer For Free Now!
View this answer and more for free by performing one of the following actions

Scan the QR code to install the App and get 2 free unlocks

Unlock quizzes for free by uploading documents