An instructor made a frequency table of the scores his students got on a test 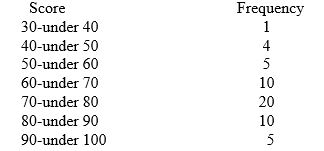 The midpoint of the last class interval is _________.
A) 90
B) 5
C) 95
D) 100
E) 50
Correct Answer:
Verified
Q3: An instructor made a frequency table of
Q4: One rule that must always be followed
Q4: A scatter plot is a two-dimensional graph
Q5: A cumulative frequency distribution provides a running
Q11: A summary of data in which raw
Q12: The difference between the highest number and
Q13: For any given data set, a frequency
Q15: If the individual class frequency is divided
Q19: A scatter plot is useful for examining
Q20: A histogram can be described as a
Unlock this Answer For Free Now!
View this answer and more for free by performing one of the following actions

Scan the QR code to install the App and get 2 free unlocks

Unlock quizzes for free by uploading documents