The figure given below shows the production possibilities frontier for Good A and Good B. In the figure below, when moving from point f to point g, the production of:
Figure 2.2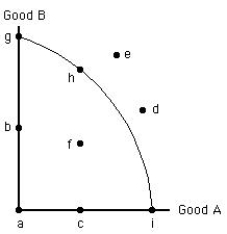
A) Good B increases without a change in the production of Good A.
B) Good A increases without a change in the production of Good B.
C) both Good A and Good B increase.
D) both Good A and Good B decrease.
E) Good B increases and the production of Good A decreases.
Correct Answer:
Verified
Q68: Points inside the production possibilities frontier represent:
A)full
Q82: As resources are not perfectly adaptable to
Q93: On a bowed-out production possibilities frontier showing
Q101: The figure below shows the production possibilities
Q103: The following figure shows the production possibilities
Q104: The figure below shows the production possibilities
Q105: The following figure shows the production possibilities
Q111: The figure below shows the production possibilities
Q122: Points outside the production possibilities frontier represent
A)unemployment
Q132: A production possibilities frontier will be bowed
Unlock this Answer For Free Now!
View this answer and more for free by performing one of the following actions

Scan the QR code to install the App and get 2 free unlocks

Unlock quizzes for free by uploading documents