The figure given below shows a backward-bending labor supply curve for an individual. In the figure below, which of the following is true at a wage rate of $7?
Figure 12.3
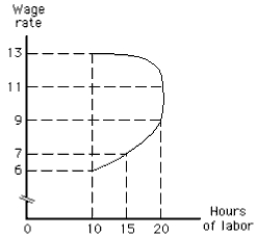
A) The income effect dominates the substitution effect.
B) The substitution effect dominates the income effect.
C) The income effect exactly offsets the substitution effect.
D) No labor is supplied.
E) The individual will supply 30 hours of labor.
Correct Answer:
Verified
Q40: An increase in the wage rate will
Q51: Which of the following statements is not
Q67: The average work week in the United
Q68: The figure given below shows a backward-bending
Q69: The figure given below shows a backward-bending
Q71: A stock market crash that reduces the
Q73: The figure given below shows a backward-bending
Q75: The figure given below shows a backward-bending
Q76: The figure given below shows a backward-bending
Q77: The figure given below shows a backward-bending
Unlock this Answer For Free Now!
View this answer and more for free by performing one of the following actions

Scan the QR code to install the App and get 2 free unlocks

Unlock quizzes for free by uploading documents