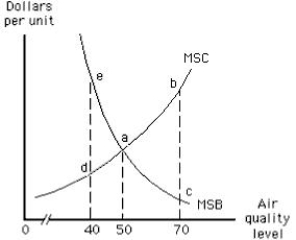
The following graph shows market equilibrium in the presence of an externality. The optimal air quality level is 50.
Figure 17.3

Correct Answer:
Verified
Q1: Oil is an example of a renewable
Q30: The equilibrium price and quantity in a
Q65: Environmental problems result when social costs and
Q105: When a system of pollution rights is
Q131: Most water pollution in the United States
Q164: Smokers and loud talkers help in generating
Q165: An increase in the marginal cost of
Q169: Coase argued that the free market should
Q171: To achieve the socially optimal level of
Q179: Pollution occurs because property rights to some
Unlock this Answer For Free Now!
View this answer and more for free by performing one of the following actions

Scan the QR code to install the App and get 2 free unlocks

Unlock quizzes for free by uploading documents