The following graph shows equilibrium in a market in the presence of externality in an economy. The total social gain from producing the socially efficient output rather than the private equilibrium output is shown by the area ______.
Figure 17.2
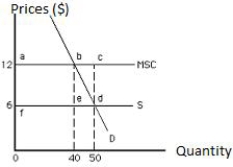
A) abdf
B) bed
C) bcd
D) acdf
E) bcde
Correct Answer:
Verified
Q30: Suppose a city builds a new park
Q32: Open-access resources tend to be _
A)conserved.
B)taxed.
C)overused.
D)efficiently used.
E)underutilized.
Q39: Which of the following is true of
Q46: Fish in the sea can be harvested
Q47: The following graph shows market equilibrium in
Q50: To solve the common-pool problem in fishing,
Q52: Which of the following is not an
Q53: The following graph shows market equilibrium in
Q55: The following graph shows market equilibrium in
Q56: The following graph shows equilibrium in a
Unlock this Answer For Free Now!
View this answer and more for free by performing one of the following actions

Scan the QR code to install the App and get 2 free unlocks

Unlock quizzes for free by uploading documents