The following graph shows the demand for and domestic supply of a good in a country. If the world price of the good is $2.00 per unit and an import quota of 50 units per month is imposed, then the gain of the foreign exporters with quota rights is represented by the area _____.
Figure 19.6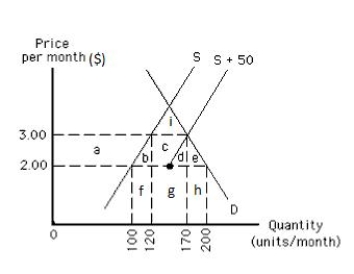
A) h
B) i
C) g
D) a and b
E) c and d
Correct Answer:
Verified
Q64: Suppose the government of an importing country
Q75: A legal limit on the amount of
Q85: Which of the following is a type
Q92: Which of the following is not a
Q95: Which of the following is not correct
Q97: Suppose the government of an importing country
Q114: The following image shows the market for
Q115: The following graph shows the demand for
Q116: The following image shows the market for
Q122: The international treaty established to negotiate lower
Unlock this Answer For Free Now!
View this answer and more for free by performing one of the following actions

Scan the QR code to install the App and get 2 free unlocks

Unlock quizzes for free by uploading documents