The following diagram is a cost-volume-profit graph for a manufacturing company: 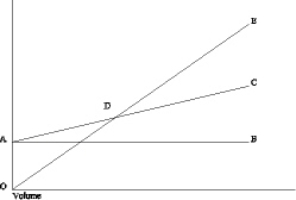 Select the answer that best describes the labeled item on the diagram.
A) Area CDE represents the area of net loss.
B) Line AC graphs total fixed costs.
C) Point D represents the point at which the contribution margin per unit increases.
D) Line AC graphs total costs.
Correct Answer:
Verified
Q12: On a profit-volume graph, the profit line
Q22: Which of the following assumptions does NOT
Q28: Which of the following assumptions does NOT
Q30: When a company sells more units than
Q34: In a profit-volume graph, the slope of
Q81: In a cost-volume-profit graph, the total revenue
Q91: The following diagram is a cost-volume-profit graph
Q92: Assuming all other things are the same,
Q95: Which of the following statements is TRUE
Q99: Which of the following assumptions is NOT
Unlock this Answer For Free Now!
View this answer and more for free by performing one of the following actions

Scan the QR code to install the App and get 2 free unlocks

Unlock quizzes for free by uploading documents