Figure 17-2 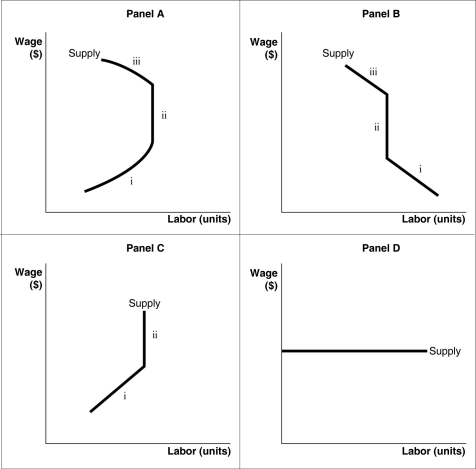
-Refer to Figure 17-2.Which of the panels in the diagram best represents an individual's labor supply curve?
A) Panel A
B) Panel B
C) Panel C
D) Panel D
Correct Answer:
Verified
Q2: A firm's primary interest when it hires
Q30: If a worker can produce 20 units
Q37: Let MP = marginal product, P =
Q71: Labor demand is considered a derived demand
Q83: The combined effect (both income and substitution)of
Q87: All of the following will shift the
Q90: Which of the following best explains why
Q95: If Molly Bee increases her work hours
Q97: An individual's labor supply curve shows
A)the maximum
Q99: How will an increase in population affect
Unlock this Answer For Free Now!
View this answer and more for free by performing one of the following actions

Scan the QR code to install the App and get 2 free unlocks

Unlock quizzes for free by uploading documents