Multiple Choice
Figure 5-6 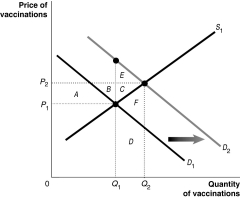 Figure 5-6 shows the market for measles vaccinations, a product whose use generates positive externalities.
-Refer to Figure 5-6.What does D2 represent?
A) the social welfare curve
B) the demand curve reflecting social benefit
C) the demand curve reflecting private benefit
D) the positive externalities curve
Correct Answer:
Verified
Related Questions
Q49: Figure 5-4 Q63: An externality is an example of a Q64: An externality refers to economic events outside Q71: When there is a positive externality in Q71: Article Summary
![]()
According to a study by the

