Figure 13-2 shows shifts in the aggregate demand curve. Which of the following combinations would be illustrated by a shift in aggregate demand from AD0 to AD2?Figure 13-2 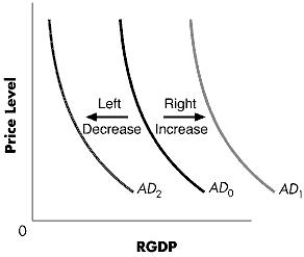
A) A decrease in the minimum wage level combined with an increase in imports
B) An increase in the price levels combined with an increase in the rates of interest
C) An increase in business tax rates combined with a decrease in consumer confidence
D) An increase in the demand for domestic goods combined with an increase in welfare activities of the government
E) An increase in imports combined with even higher increase in exports
Correct Answer:
Verified
Q48: The short-run aggregate supply curve is:
A)typically vertical.
B)typically
Q49: If the stock market of a country
Q50: Figure 13-3 shows the relationship between real
Q51: Which of the following statements is true?
A)The
Q52: Which of the following increases U.S. aggregate
Q54: The short-run aggregate supply curve is drawn
Q55: The long run refers to:
A)a time period
Q56: One explanation for an upward-sloping short-run aggregate
Q57: Faster growth rates of a nation's major
Q58: Which of the following would be true
Unlock this Answer For Free Now!
View this answer and more for free by performing one of the following actions

Scan the QR code to install the App and get 2 free unlocks

Unlock quizzes for free by uploading documents