The graph shows the market for wheat in an economy. The equilibrium price and quantity of wheat bought and sold in the domestic market in the absence of international trade are P2 and Q2, respectively. If the world price of wheat is P3, the net domestic gain from trade is shown by area _____ in the graph.Figure 18.1 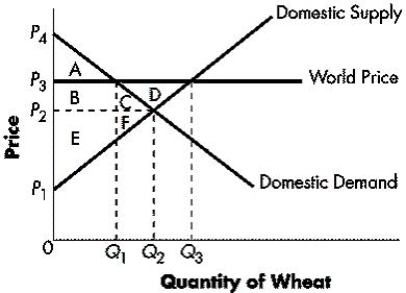
A) A
B) B
C) C
D) D
E) E
Correct Answer:
Verified
Q47: The imposition of an import quota on
Q48: Which of the following would likely be
Q49: With free trade and imports, _.
A)domestic consumers
Q50: Which of the following arguments does not
Q51: When exports are subsidized, _.
A)income is transferred
Q53: The imposition of an import quota on
Q54: The graph shows the market for wheat
Q55: A tariff differs from a quota in
Q56: The graph shows the market for wheat
Q57: An increase in the existing tariff on
Unlock this Answer For Free Now!
View this answer and more for free by performing one of the following actions

Scan the QR code to install the App and get 2 free unlocks

Unlock quizzes for free by uploading documents