Use the following to answer question
Figure: Interpreting Surplus 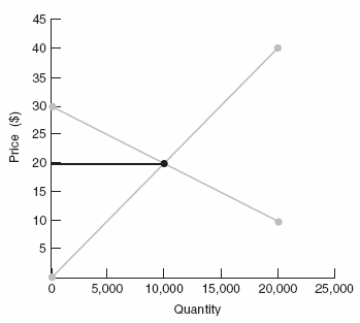
-(Figure: Interpreting Surplus) In the supply/demand graph:
A) consumer surplus is $50,000 and producer surplus is $100,000.
B) total market surplus is $200,000.
C) total market surplus is $50,000.
D) consumer surplus exceeds producer surplus.
Correct Answer:
Verified
Q58: Use the following to answer questions
Figure:
Q59: Use the following to answer questions
Figure:
Q60: Use the following to answer questions
Figure:
Q61: Use the following to answer question
Figure:
Q61: Total surplus is calculated as
A) consumer surplus
Q62: Use the following to answer questions
Figure:
Q64: Use the following to answer questions
Figure:
Q65: Use the following to answer questions
Figure:
Q67: Use the following to answer questions
Figure:
Q68: Use the following to answer questions
Figure:
Unlock this Answer For Free Now!
View this answer and more for free by performing one of the following actions

Scan the QR code to install the App and get 2 free unlocks

Unlock quizzes for free by uploading documents