Multiple Choice
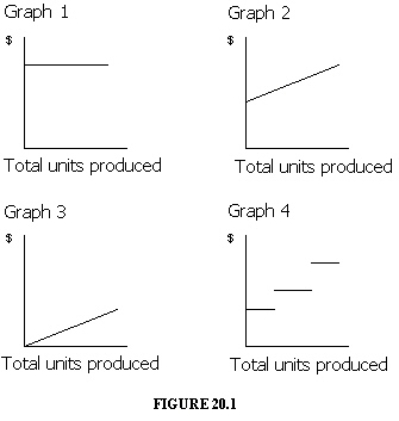 Which of the graphs in Figure 20-1 illustrates the behavior of a total fixed cost?
A) Graph 2
B) Graph 3
C) Graph 4
D) Graph 1
Correct Answer:
Verified
Related Questions
Q42: If fixed costs are $650,000 and the
Q46: In an absorption costing income statement, the
Q47: Garmo Co. has an operating leverage of
Q52: Companies with large amounts of fixed costs
Q55: If the unit selling price is $40,
Q62: Which of the following is an example
Unlock this Answer For Free Now!
View this answer and more for free by performing one of the following actions

Scan the QR code to install the App and get 2 free unlocks

Unlock quizzes for free by uploading documents