10-10. Using the figure below, which of the following statements BEST describes the data? 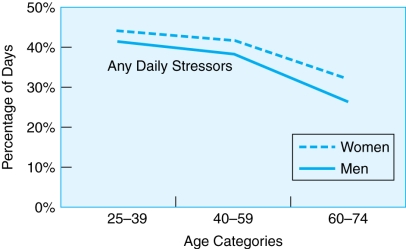 Source: Adapted from Almeida & Horn (2004) .
A) Men and women report having more days with stressors as they go from middle (40-59) to older adulthood
B) Men and women report having about the same days with stressors as they go from middle(40-59) to older adulthood
C) Men and women report having fewer days with stressors as they go from middle (40-59_ to older adulthood
D) Men report more days with stressors than women at all ages
Correct Answer:
Verified
Q2: According to Yehuda, which gender is most
Q3: According to Selye's theory of the general
Q6: "Stress can be defined as the body's
Q7: 10-12. According to Yehuda, which gender is
Q12: Which of the following would be an
Q13: Which of the following features of a
Q14: The observed beneficial effect of social support
Q15: Which one researcher and theorist has most
Q15: Which one researcher and theorist has most
Q16: The first phase of the "general adaptation
Unlock this Answer For Free Now!
View this answer and more for free by performing one of the following actions

Scan the QR code to install the App and get 2 free unlocks

Unlock quizzes for free by uploading documents