Figure: Supply Shift 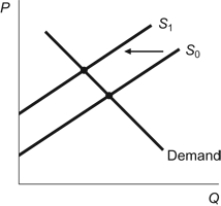 In the figure,the supply curve shifted from S0 to S1.To describe this movement,we would say that:
A) demand decreased,which caused a decrease in supply.
B) supply decreased,which caused a decrease in quantity demanded.
C) supply decreased,which caused a decrease in demand.
D) supply increased,which caused a decrease in quantity demanded.
Correct Answer:
Verified
Q141: When you move along a demand curve:
A)
Q142: Technological advances have increased the supply of
Q142: Figure: Four Panel 2 Q148: Figure: Demand Shift Q149: When supply decreases there is a _ Q151: Higher gasoline prices have led to a Q153: After a hurricane in Florida destroys half Q158: A demand curve shows the relationship between: Q159: When the price of a good increases, Q177: An increase in the quantity supplied results![]()
![]()
A)
Unlock this Answer For Free Now!
View this answer and more for free by performing one of the following actions

Scan the QR code to install the App and get 2 free unlocks

Unlock quizzes for free by uploading documents