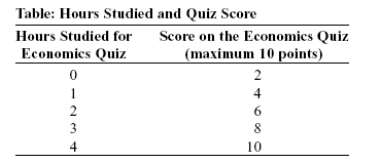
Use the following to answer question 19: 
-(Table: Hours Studied and Quiz Score) Use Table: Hours Studied and Quiz Score.The table shows data for students in an economics class.If we were to graph these data and draw a line through the points,we would choose _____ to be the independent variable;the vertical intercept of our line would be _____;and the slope of our line would be _____.
A) quiz score;y = 2;-2
B) quiz score;x = 0;-2
C) hours studied;y = 0;+2
D) hours studied;y = 2;+2
Correct Answer:
Verified
Q7: If two variables are negatively related,they will
Q8: On a two-dimensional graph representing two variables:
A)a
Q16: If two variables are positively related:
A)as one
Q17: The relation between two variables that move
Q18: The point at which the axes of
Q19: If two variables are negatively related:
A)as one
Q20: Use the following to answer question:
Q21: Use the following to answer questions:
Q23: Use the following to answer questions:
Q33: Use the following to answer question:
Unlock this Answer For Free Now!
View this answer and more for free by performing one of the following actions

Scan the QR code to install the App and get 2 free unlocks

Unlock quizzes for free by uploading documents