A business owner recorded her annual profits for the first 12 years since opening her business in 1993.The stem-and-leaf display below shows the annual profits in thousands of dollars.Use both the stemplot and timeplot to describe the distribution. Annual Profit Totals 8
7
6
5
4
3
2
1 Key:
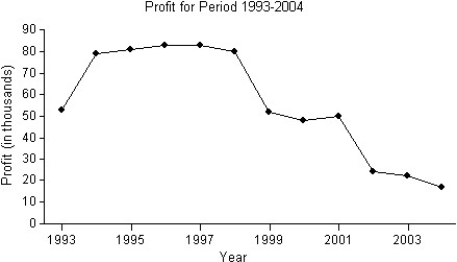
A) The distribution of the business owner's profits is skewed to the left,and is unimodal,with gaps in between.The centre is at around $50,000.The timeplot shows that the profits grew from 1993 to 1994,and were relatively steady from 1994 to 1998.After 1998,the profits declined significantly compared with those between 1993 and 1998.
B) The distribution of the business owner's profits is skewed to the left,and is multimodal,with gaps in between.One mode is at around $80,000,another at around $50,000,and a third mode at around $20,000.The timeplot shows that the profits grew from 1993 to 1994,and were relatively steady from 1994 to 2001.After 2001,the profits declined significantly compared with those between 1994 and 2001.
C) The distribution of the business owner's profits is skewed to the right,and is multimodal,with gaps in between.One mode is at around $80,000,another at around $50,000,and a third mode at around $20,000.The timeplot shows that the profits grew from 1993 to 1994,and were relatively steady from 1994 to 1998.After 1998,the profits declined significantly compared with those between 1993 and 1998.
D) The distribution of the business owner's profits is skewed to the left,and is multimodal,with gaps in between.One mode is at around $80,000,another at around $50,000,and a third mode at around $20,000.The timeplot shows that the profits grew from 1993 to 1994,and were relatively steady from 1994 to 1998.After 1998,the profits declined significantly compared with those between 1993 and 1998.
E) The distribution of the business owner's profits is skewed to the left,and is unimodal,with gaps in between.The centre is at around $50,000.The timeplot shows that the profits grew from 1993 to 1994,and were relatively steady from 1994 to 2001.After 2001,the profits declined significantly compared with those between 1994 and 2001.
Correct Answer:
Verified
Q27: Use the high closing values of
Q28: Here are the heights,in centimetres,of 32 Grade
Q29: The ages of the 21 members of
Q30: The boxplots display case prices (in dollars)of
Q31: The Ontario Ministry of Education collects data
Q33: The weekly salaries (in dollars)of sixteen government
Q34: Use the high closing values of
Q35: The test scores of 15 students are
Q36: Here are the test scores of 32
Q37: The boxplots display case prices (in dollars)of
Unlock this Answer For Free Now!
View this answer and more for free by performing one of the following actions

Scan the QR code to install the App and get 2 free unlocks

Unlock quizzes for free by uploading documents