The histogram shows the cost of living,in dollars,in 32 Canadian towns. 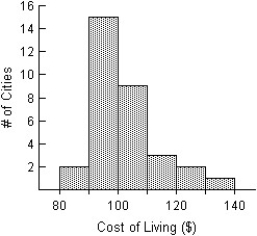
A) The distribution of the cost of living in the 32 Canadian cities is unimodal and skewed to the right.The distribution is centred around $100,and spread out,with values ranging from $80 to $139.99.
B) The distribution of the cost of living in the 32 Canadian cities is unimodal and skewed to the right.The distribution is centred around $110,and spread out,with values ranging from $80 to $140.
C) The distribution of the cost of living in the 32 Canadian cities is unimodal and skewed to the right.The distribution is centred around $90,and spread out,with values ranging from $80 to $139.99.
D) The distribution of the cost of living in the 32 Canadian cities is unimodal and skewed to the left.The distribution is centred around $100,and spread out,with values ranging from $80 to $139.99.
E) The distribution of the cost of living in the 32 Canadian cities is unimodal.The distribution is centred around $100,and spread out,with values ranging from $80 to $140.
Correct Answer:
Verified
Q10: A university instructor created a website for
Q11: The diastolic blood pressures,in mm Hg,for a
Q12: Number of times each face of a
Q13: Ages of patients who had their tonsils
Q14: Heights of a group of male professional
Q16: In a college health course,65 students participated
Q17: Number of innings in the baseball games
Q18: The histogram shows the sizes (in acres)of
Q19: The diastolic blood pressures,in mm Hg,for a
Q20: The data below represent the midterm grades
Unlock this Answer For Free Now!
View this answer and more for free by performing one of the following actions

Scan the QR code to install the App and get 2 free unlocks

Unlock quizzes for free by uploading documents