Shown below are the boxplot and the histogram for the weekly salaries (in dollars) of 24 randomly selected employees of a company: 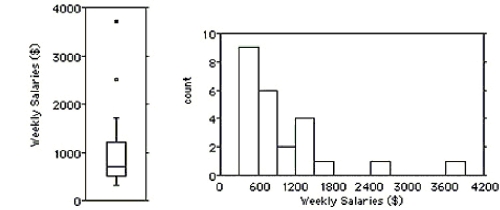
i) What features of the distribution can you see in both the histogram and the boxplot?
ii) What features of the distribution can you see in the boxplot that you could not see in the histogram?
A) i) The distribution is unimodal and skewed to the right,with two outliers at $2500 and about $3700.The mean is greater than the median because of the skewedness. ii) You can more easily tell from the boxplot that the median is about $700 with quartiles at about $500 and $1200.
B) i) The distribution is symmetrical,with two outliers at $2900 and about $3000.The mean and median are about the same. ii) You can more easily tell from the boxplot that the mean is about $500 with quartiles at about $700 and $1800.
C) i) The distribution is unimodal and skewed to the left,with two outliers at $2500 and about $3700.The mean is lower than the median because of the skewedness. ii) You can more easily tell from the boxplot that the median is about $900 with quartiles at about $1100 and $1600.
D) i) The distribution is unimodal and skewed to the right,with two outliers at $2900 and about $3000.The mean is greater than the median because of the skewedness. ii) You can more easily tell from the boxplot that the median is about $700 with quartiles at about $500 and $1200.
E) i) The distribution is symmetrical,with two outliers at $2500 and about $3700.The mean and median are about the same. ii) You can more easily tell from the boxplot that the mean is about $700 with quartiles at about $500 and $1200.
Correct Answer:
Verified
Q92: Shown below are the histogram and
Q93: Shown below are the boxplot and
Q94: The ages of the 21 members of
Q95: Shown below are the boxplot and the
Q96: Shown below are the boxplot and the
Q98: A sewing supply company has a
Q99: Here are the prices for 8 different
Q100: The following data consists of the
Q101: Here are the average mathematics achievement
Q102: The heights,in centimetres,of 18 randomly selected
Unlock this Answer For Free Now!
View this answer and more for free by performing one of the following actions

Scan the QR code to install the App and get 2 free unlocks

Unlock quizzes for free by uploading documents