The following table gives the average number of voters in each of three political parties during the last 12 years, along with the average number that voted in presidential elections during this period. Use these data to find the probability, rounded to two decimal places, that a person selected at random from the registered Democratic voters will vote in the next election. 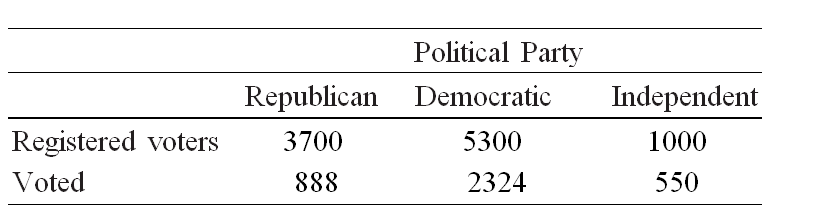
A) Pr(Democratic will vote) = 0.55
B) Pr(Democratic will vote) = 0.44
C) Pr(Democratic will vote) = 0.24
D) Pr(Democratic will vote) = 0.56
E) Pr(Democratic will vote) = 0.45
Correct Answer:
Verified
Q5: Fifty-seven percent of marijuana use among youth
Q9: From a deck of 52 ordinary playing
Q10: An urn contains three red R balls
Q11: If the odds that a particular horse
Q12: An urn contains three red R balls
Q13: If a pair of dice, one green
Q15: An ordinary die is tossed. What is
Q16: Suppose a die is tossed 1500 times
Q18: In a sales promotion, a clothing store
Q19: One ball is drawn at random from
Unlock this Answer For Free Now!
View this answer and more for free by performing one of the following actions

Scan the QR code to install the App and get 2 free unlocks

Unlock quizzes for free by uploading documents