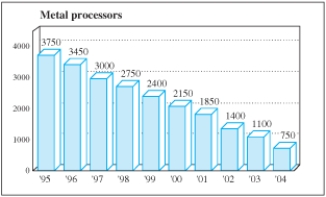
The following figure, from Investor's Business Daily (March 5, 1998) , shows how quickly the U.S. metal processing industry isconsolidating. The linear equation that is the best fit for the number of metal processors as a function of years after 1990 is  , and the best exponential fit is
 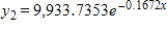 . The linear equation seems to give a much better fit for the data points than the exponential equation. Why then is the exponential equation a more useful model to predict the number of metal processors in
  ?
? 
A) The quantity of metal processing units as a function of time is exponential for the first five years, and linear for the next five years.
B) As the quantity of metal processors decreases, they decrease at an increasingly logarithmic rate as a function of time.
C) The number of metal processing units will probably start to increase in 2007.
D) The linear model gives a negative number of processors in 2010. The exponential model is always non-negative.
E) The number of metal processing units follows a parabolic model.
Correct Answer:
Verified
Q11: Given Q12: Use a calculator to evaluate the expression. Q13: Use a calculator to evaluate the expression. Q14: Use a calculator to evaluate the expression. Q15: Let Q17: We will show in the next chapter Q18: The percent concentration y of a certain Q19: Use a calculator to evaluate the expression. Q20: Graph the function. Q21: Solve for x by writing the equation Unlock this Answer For Free Now! View this answer and more for free by performing one of the following actions Scan the QR code to install the App and get 2 free unlocks Unlock quizzes for free by uploading documents![]()
![]()
![]()

