The graph in the figure shows the force on an object as a function of the elongation caused by that force. Which statement about this object is true? 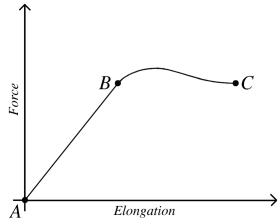
A) The object obeys Hooke's law at all points from A to C.
B) The object obeys Hooke's law at all points from B to C.
C) The object obeys Hooke's law at all points from A to B.
D) The elastic limit occurs at point C.
E) The region of elastic behavior occurs from B to C.
Correct Answer:
Verified
Q1: A 3.00-kg ball rests in a frictionless
Q5: A 30.0-kg child sits on one end
Q6: Two compressible solids are formed into spheres
Q7: In the figure, the horizontal lower arm
Q7: If the torque on an object adds
Q8: A 120-kg refrigerator,2.00 m tall and 85.0
Q8: A stepladder consists of two halves, hinged
Q9: An 82.0 kg-diver stands at the edge
Q10: A 5.0-m long, 12-kg uniform ladder rests
Q11: Two identical ladders are 3.0 m long
Unlock this Answer For Free Now!
View this answer and more for free by performing one of the following actions

Scan the QR code to install the App and get 2 free unlocks

Unlock quizzes for free by uploading documents