Exhibit 5-1 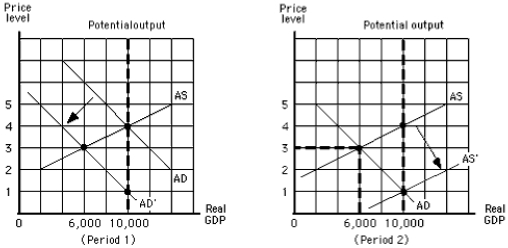
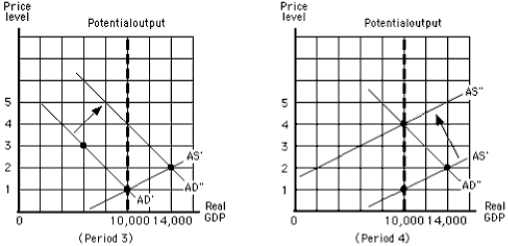
-Exhibit 5-1 shows that from the beginning of period 1 to the end of period 2,
A) real GDP decreased and then increased
B) real GDP increased and then decreased
C) real GDP fell from $10,000 to $6,000
D) real GDP rose from $6,000 to $10,000
E) the inflation rate fell from 4 to 1
Correct Answer:
Verified
Q61: In terms of the aggregate demand and
Q63: Exhibit 5-1 Q64: According to John Maynard Keynes' General Theory Q65: On an aggregate demand and aggregate supply Q67: Adam Smith's "invisible hand" explains Q68: Equilibrium of aggregate supply and aggregate demand![]()
A)why people act
Unlock this Answer For Free Now!
View this answer and more for free by performing one of the following actions

Scan the QR code to install the App and get 2 free unlocks

Unlock quizzes for free by uploading documents