Refer to the following figure when answering
Figure 12.10: Output Gap: 1990-2000 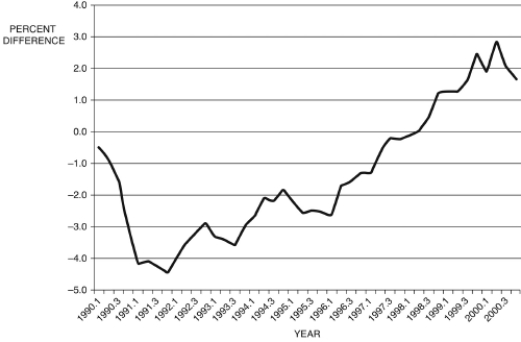
(Source: Federal Reserve Economic Data, St. Louis Federal Reserve)
-Consider Figure 12.10, which shows the output gap from 1990 to 2000, by quarter. If this is all the information you have, during the period 1993.1-1993.4, from the Phillips curve, you would conclude that:
A) inflation is decelerating,
B) inflation is accelerating,
C) unemployment is falling
D) unemployment is rising
E) Not enough information is given.
Correct Answer:
Verified
Q61: Figure 12.8: Output Q68: One of the remarkable things about the Q70: Which of the following statements is NOT Q71: As lender in the last resort, the Q77: Refer to the following figure when Q86: Which of the following innovations have become Q87: When a central bank targets the money Q88: Which of the following are the "conventional Q89: Once a _ is chosen, the main Q94: The link between real and nominal interest![]()
Unlock this Answer For Free Now!
View this answer and more for free by performing one of the following actions

Scan the QR code to install the App and get 2 free unlocks

Unlock quizzes for free by uploading documents