Figure 20.6: Dollar-Euro Exchange Rate 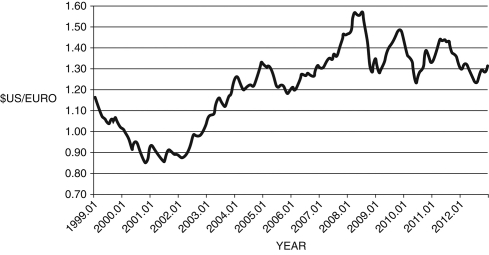 (Source: Federal Reserve Economic Data, St. Louis Federal Reserve)
-In December 2007, the United States entered a recession. As seen in Figure 20.6, the U.S. dollar depreciated about 100 percent vis-á-vis the euro between 2001 and 2007. Explain the relationship between the recession and the depreciation of the dollar. What does the short-run model suggest should happen to net exports and the output gap?
Correct Answer:
Verified
View Answer
Unlock this answer now
Get Access to more Verified Answers free of charge
Q118: Buying at a low price in one
Q120: The following best describes the relationship
Q122: The end of the Bretton Woods standard
Q124: In our open-economy SR Macro model, analyze
Q127: Figure 20.5 shows 10-year bond yields for
Q129: The Mexican peso crisis was precipitated, in
Q134: During the 1990s, the Yugoslavian countries of
Q140: In the long run, what value should
Q141: One impact of the Southeast Asian crisis
Q142: Despite the European Central Bank's (ECB) hawkish
Unlock this Answer For Free Now!
View this answer and more for free by performing one of the following actions

Scan the QR code to install the App and get 2 free unlocks

Unlock quizzes for free by uploading documents