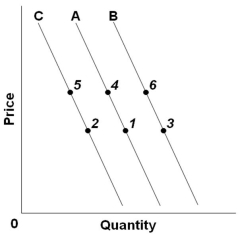
 Refer to the above graph with three demand curves. An "increase in quantity demanded" would be illustrated by a change from:
A) Point 4 to point 6
B) Point 5 to point 1
C) Point 4 to point 1
D) Point 2 to point 5
Correct Answer:
Verified
Q31: Q32: Which of the following will not cause Q33: Which of the following goods would most Q34: If product Y is an inferior good, Q35: An increase in the price of digital Q37: If the price of gasoline increases significantly, Q38: Which of the following factors will decrease Q39: Which of the following pairs are not Q40: Use the following graph of the demand Q41: ![]()
![]()
Unlock this Answer For Free Now!
View this answer and more for free by performing one of the following actions

Scan the QR code to install the App and get 2 free unlocks

Unlock quizzes for free by uploading documents