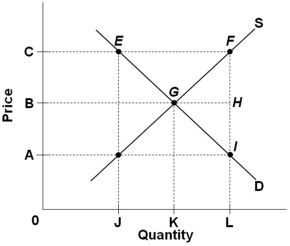
 The graph above represents a competitive market for a product where the government now has introduced a price floor of 0C. Which area in the graph represents the producers' sales revenue after the imposition of the price floor?
A) 0CFL
B) 0CEJ
C) 0BGK
D) 0BHL
Correct Answer:
Verified
Q3: "Price" in the statement of the Law
Q18: The law of demand states that if
Q139: Q140: Q141: One objection to a competitive and legal Q142: The law of supply states that, ceteris Q145: Which of the following is an example Q146: A decrease in the prices of computer Unlock this Answer For Free Now! View this answer and more for free by performing one of the following actions Scan the QR code to install the App and get 2 free unlocks Unlock quizzes for free by uploading documents![]()
![]()

