Assume that the graphs show a competitive market for the product stated in the question. 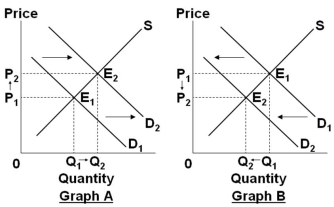
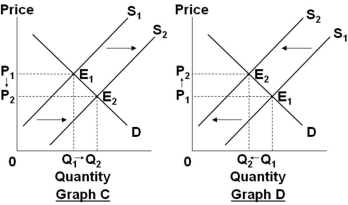 Select the graph above that best shows the change in the market specified in the following situation: In the market for gasoline, when the price of oil, which is used to produce gasoline, increases because of reduced production by major oil-producing nations.
A) Graph A
B) Graph B
C) Graph C
D) Graph D
Correct Answer:
Verified
Q42: If the organizers of a major sports
Q186: The scalping of tickets for an event
Q187: The graph below shows the market for
Q189: The supply curve in a market is
Q192: If the price of oil increases significantly,
Q194: In the market for crude oil, if
Q195: The graph below shows the market for
Q196: Assume that the graphs show a competitive
Q329: In the foreign exchange market, if Americans
Q330: In the foreign exchange market, if Canadian
Unlock this Answer For Free Now!
View this answer and more for free by performing one of the following actions

Scan the QR code to install the App and get 2 free unlocks

Unlock quizzes for free by uploading documents