Assume that the graphs show a competitive market for the product stated in the question. 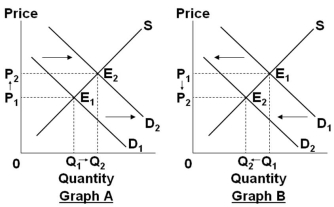
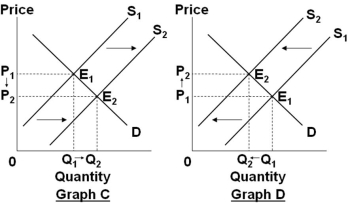 Select the graph above that best shows the change in the market specified in the following situation: In the market for wheat, when the cost of fertilizer decreases.
A) Graph A
B) Graph B
C) Graph C
D) Graph D
Correct Answer:
Verified
Q32: If we observe that the price of
Q34: If the government subsidizes the car makers
Q37: A surplus indicates that the quantity demanded
Q39: If the decrease in supply is less
Q52: In the market for sushi, an increase
Q177: A headline reads "Perfect Weather Brings Record-High
Q182: The graph below shows the market for
Q185: In markets where the supply curve is
Q186: The scalping of tickets for an event
Q327: What would best explain why the equilibrium
Unlock this Answer For Free Now!
View this answer and more for free by performing one of the following actions

Scan the QR code to install the App and get 2 free unlocks

Unlock quizzes for free by uploading documents