Multiple Choice
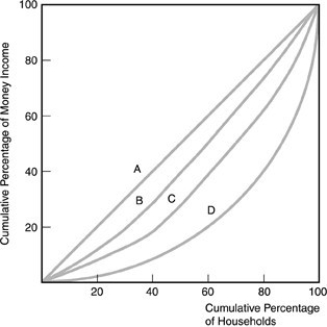
-The above figure displays
A) income-inequality curves.
B) Gini Coefficients.
C) Lorenz curves.
D) Laffer curves.
Correct Answer:
Verified
Related Questions
Q31: The Lorenz curve
A) shows what portion of
Q32: Since World War II, the share of
Q33: Q34: Q35: A Lorenz curve that is perfectly straight Q37: Compared to a sampling of other developed Unlock this Answer For Free Now! View this answer and more for free by performing one of the following actions Scan the QR code to install the App and get 2 free unlocks Unlock quizzes for free by uploading documents![]()
![]()

