Multiple Choice
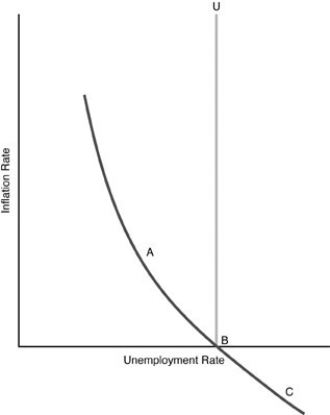
-In the above figure, what does the line U represent?
A) the Phillips curve
B) the natural rate of unemployment
C) potential unemployment
D) full inflation rate of unemployment
Correct Answer:
Verified
Related Questions
Q103: The Phillips curve shows the relationship between
A)
Q104: Which of the following curves shows the
Q105: Q106: An unexpected increase in aggregate demand Q107: If households and businesses correctly anticipate the Unlock this Answer For Free Now! View this answer and more for free by performing one of the following actions Scan the QR code to install the App and get 2 free unlocks Unlock quizzes for free by uploading documents![]()
A) causes

