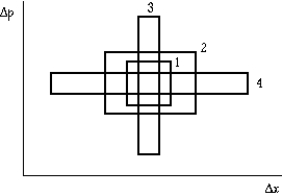
 The graph shows the uncertainty in measuring the position x and momentum p of a particle in four experiments. Region 1 has area h, region 2 has area 4h, region 3 has area 2h, and region 4 has area 3h. The region that correctly represents the uncertainty principle is
A) 1
B) 2
C) 3
D) 4
E) All of these are correct.
Correct Answer:
Verified
Q82: An electron has a kinetic energy of
Q83: A classical wave
A)behaves like a water wave.
B)exhibits
Q86: The uncertainty principle states that
A)only momentum and
Q94: Which of the following statements is/are true?
A)Nothing
Q99: You want to make simultaneous measurements
Q102: An electron is in a one-dimensional box
Q109: With a microscope using photons you
Q117: Use the following figure to answer
Q118: Use the following figure to answer
Q119: An electron is confined to a
Unlock this Answer For Free Now!
View this answer and more for free by performing one of the following actions

Scan the QR code to install the App and get 2 free unlocks

Unlock quizzes for free by uploading documents