Looking at the runs plot of gasoline prices over the past 30 months,describe what it tells us about the price of gas during these 30 months. 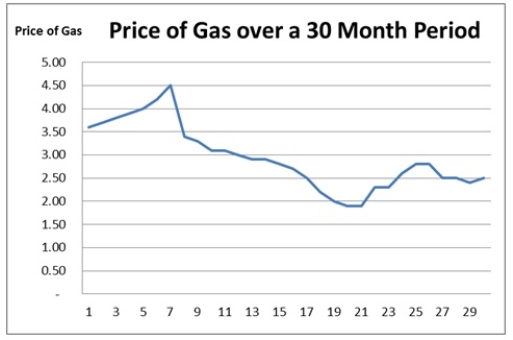
Correct Answer:
Verified
View Answer
Unlock this answer now
Get Access to more Verified Answers free of charge
Q81: When the data being studied are gathered
Q82: A sequence of operations that takes inputs
Q84: Data collected for a particular study are
Q85: _ refers to describing the important aspects
Q85: One method of determining whether a sample
Q87: A study is being conducted on the
Q90: If we collect data on the number
Q92: A _ variable can have values that
Q93: The change in the daily price of
Q94: A(n) _ variable can have values that
Unlock this Answer For Free Now!
View this answer and more for free by performing one of the following actions

Scan the QR code to install the App and get 2 free unlocks

Unlock quizzes for free by uploading documents