Exhibit 14-5.An marketing analyst wants to examine the relationship between sales (in $1,000s) and advertising (in $100s) for firms in the food and beverage industry and collects monthly data for 25 firms.He estimates the model  .The following table below shows a portion of the regression results.
 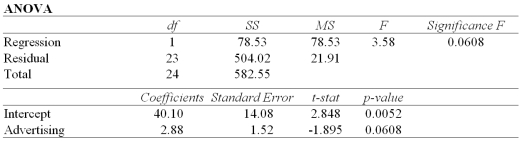 Refer to Exhibit 14-5.Calculate the standard error of the estimate.
A) 4.68
B) 8.86
C) 21.91
D) 78.53
Correct Answer:
Verified
Q74: Exhibit 14-3.Consider the following sample regression equation
Q75: Exhibit 14-2.A statistics student is asked to
Q76: Exhibit 14-1.Over the past 30 years,the sample
Q77: Exhibit 14-5.An marketing analyst wants to examine
Q78: Exhibit 14-4.Consider the following sample regression equation
Q80: Exhibit 14-3.Consider the following sample regression equation
Q81: Exhibit 14-6.A manager at a local bank
Q82: Exhibit 14-7.Assume you ran a multiple regression
Q83: Exhibit 14-10.A sociologist examines the relationship between
Q84: A statistics instructor wants to examine the
Unlock this Answer For Free Now!
View this answer and more for free by performing one of the following actions

Scan the QR code to install the App and get 2 free unlocks

Unlock quizzes for free by uploading documents