Exhibit 2A-2 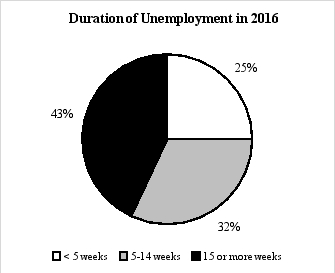
-The type of chart shown in Exhibit 2A-2 is referred to as a
A) dual-scale diagram.
B) time-series graph.
C) bar chart.
D) pie chart.
E) scatter diagram.
Correct Answer:
Verified
Q100: Using gasoline prices as an example, explain
Q101: Exhibit 2A-3 Q102: Exhibit 2A-2 Q103: Describe an experiment that you would run Q104: Indicate whether you expect positive or negative Q106: Suppose an economic study shows that increasing Q107: Refer to the information in the following Q108: Interpret the following data on the relative Q109: Exhibit 2A-3 Q110: Exhibit 2A-3 Unlock this Answer For Free Now! View this answer and more for free by performing one of the following actions Scan the QR code to install the App and get 2 free unlocks Unlock quizzes for free by uploading documents![]()
![]()
![]()
![]()

