The following is a plot of the residuals versus fat for 26 menu items at a fast food restaurant. 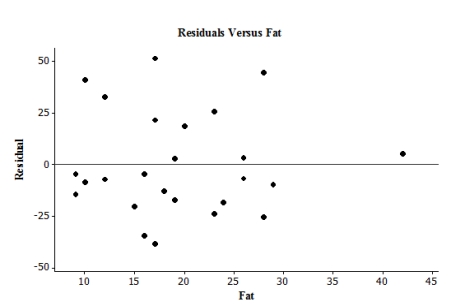 Which of the following statements is supported by this plot?
A) A linear model is appropriate for explaining the relationship between the explanatory and response variables for this case.
B) There is evidence that the deviations described by the model are not Normal in distribution.
C) The abundance of outliers and influential observations in the plot means that the assumptions for regression are clearly violated.
D) None of the answer options is correct.
Correct Answer:
Verified
Q1: You can visit the official website
Q2: Forced expiratory volume (FEV) is the volume
Q3: You can visit the official website
Q5: Forced expiratory volume (FEV) is the volume
Q6: The scatterplot below suggests a linear
Q7: Forced expiratory volume (FEV) is the volume
Q8: You can visit the official website
Q9: Frequent food questionnaires (FFQs) are often given
Q10: Frequent food questionnaires (FFQs) are often given
Q11: A random sample of 19 companies
Unlock this Answer For Free Now!
View this answer and more for free by performing one of the following actions

Scan the QR code to install the App and get 2 free unlocks

Unlock quizzes for free by uploading documents